Fig. 3
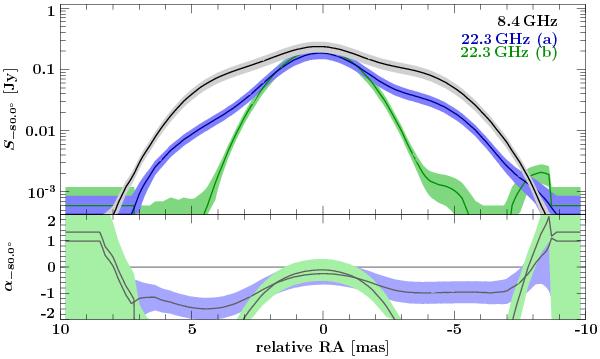
Top: flux density profiles along PA = −80° at 8.4 GHz (gray) and 22.3 GHz “extended model” (blue, a)) and “compact model” (green, b)). Bottom: spectral index along PA = −80°. Displayed uncertainties correspond to a conservative estimate of absolute calibration uncertainties and on-source errors of ~20%. The spectral index distribution of the “extended model” is in light blue, the “compact model” is shown in light green.
Current usage metrics show cumulative count of Article Views (full-text article views including HTML views, PDF and ePub downloads, according to the available data) and Abstracts Views on Vision4Press platform.
Data correspond to usage on the plateform after 2015. The current usage metrics is available 48-96 hours after online publication and is updated daily on week days.
Initial download of the metrics may take a while.