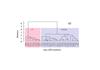
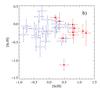
Fig. 7

a) Dendogram plot of the hierarchical tree resulting from the cluster analysis of the 14-species chemical abundances of the sample without errors. The x-axis gives the HD numbers of the stars and the y-axis represents the Euclidean distance, in the normalized abundance space, between subgroups. The two main groups are identified by the labeled boxes. b) Scandium abundances as a function of strontium. The two main groups identified above are projected with different symbol: filled triangle stand for CP stars, open circles represent normal stars.
Current usage metrics show cumulative count of Article Views (full-text article views including HTML views, PDF and ePub downloads, according to the available data) and Abstracts Views on Vision4Press platform.
Data correspond to usage on the plateform after 2015. The current usage metrics is available 48-96 hours after online publication and is updated daily on week days.
Initial download of the metrics may take a while.