Fig. 6
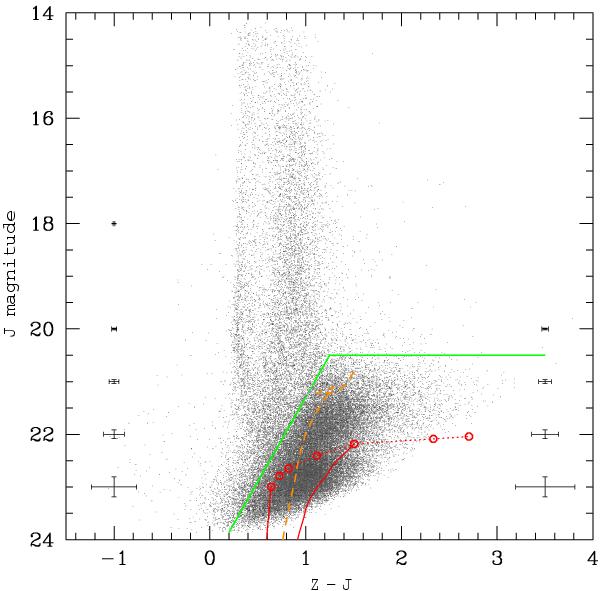
CMD of catalog A stars with theoretical loci superimposed. The models are computed with the CMD tool at stev.oapd.inaf.it/cmd and shifted by a distance modulus of 27.7. Open circles, connected with a dotted line, show the location of the RGB Tip of 10 Gyr old isochrones with metallicity Z = (0.0001, 0.0004, 0.001, 0.004, 0.008, 0.019 and 0.03), falling, respectively, at J = (23, 22.79, 22.65, 22.4, 22.18, 22.09 and 22.04). Solid thick red lines show the RGB portion of 10 Gyr old isochrones with Z = 0.0001 and Z = 0.008; the dashed orange line shows a 1 Gyr old isochrone with Z = 0.008. The solid green line shows the boundary below which most stellar sources are likely members of NGC 253 (see text). 1σ error bars are shown for two values of the star’s color: those on the left refer to J − Z = 0.5, while those on the right to J − Z = 1.2 mag.
Current usage metrics show cumulative count of Article Views (full-text article views including HTML views, PDF and ePub downloads, according to the available data) and Abstracts Views on Vision4Press platform.
Data correspond to usage on the plateform after 2015. The current usage metrics is available 48-96 hours after online publication and is updated daily on week days.
Initial download of the metrics may take a while.