Fig. 5
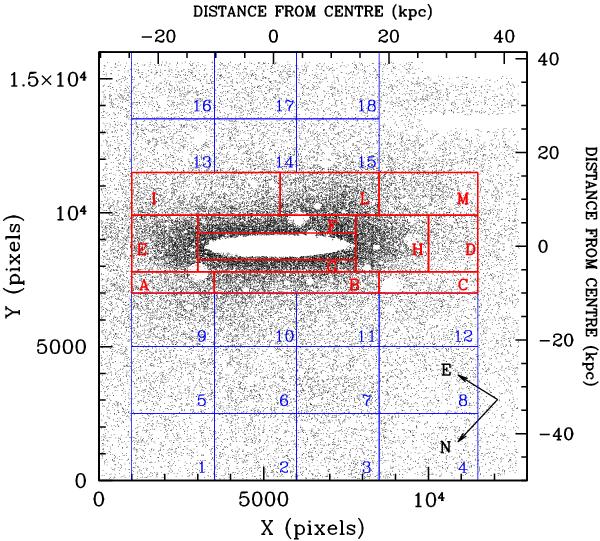
Spatial distribution of catalog A stars on the VISTA tile (J band) oriented along the detector coordinates. The upper and right axis are labelled with physical coordinates in kpc centered on the galaxy center. Holes are clearly visible in the spatial distribution. These are due to the masking of bright foreground stars. The inner part of the disk has also been masked, because source crowding prevents accurate photometry on our images. In the upper right corner, two white rectangles show other regions with defects, where the photometry could not be performed. The cumulative area of the masked regions is a small fraction of the total surveyed area. Solid lines show the rectangular subregions into which we divide the tile to draw the spatially resolved CMDs shown in Figs. 11 and 19. The subregions are drawn so as to sample a statistically significant population of stars, and are identified with progressive numbers and letters, for the halo and the disk regions respectively.
Current usage metrics show cumulative count of Article Views (full-text article views including HTML views, PDF and ePub downloads, according to the available data) and Abstracts Views on Vision4Press platform.
Data correspond to usage on the plateform after 2015. The current usage metrics is available 48-96 hours after online publication and is updated daily on week days.
Initial download of the metrics may take a while.