Fig. 4
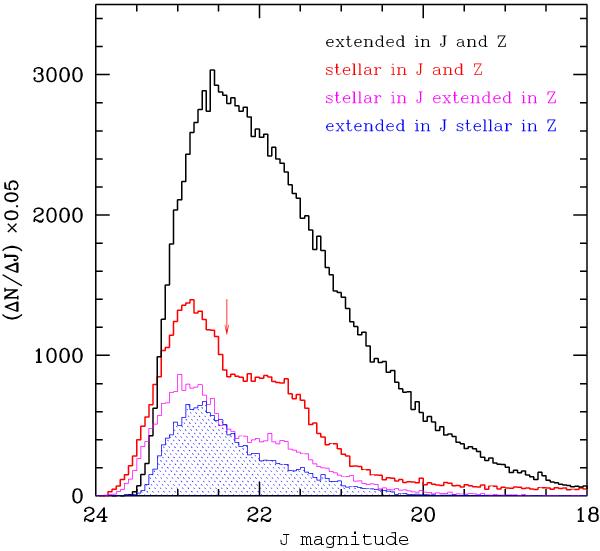
Luminosity functions of the different kinds of sources whose CMDs are shown in Fig. 3. The thick red line shows the distribution of sources classified as stellar in both filters corresponding to panel a) of Fig. 3 and the thick black line is used for the sources classified as extended in both filters, corresponding to panel b). The thin magenta line and the shaded blue histograms refer to the sources shown in panels c) and d) of Fig. 3. Labels in the figure follow the order of the histograms from top to bottom. The arrow indicates the magnitude at which we expect the Tip of the RGB for a stellar population with metallicity Z = 0.008, and a distance modulus of 27.7.
Current usage metrics show cumulative count of Article Views (full-text article views including HTML views, PDF and ePub downloads, according to the available data) and Abstracts Views on Vision4Press platform.
Data correspond to usage on the plateform after 2015. The current usage metrics is available 48-96 hours after online publication and is updated daily on week days.
Initial download of the metrics may take a while.