Fig. 3
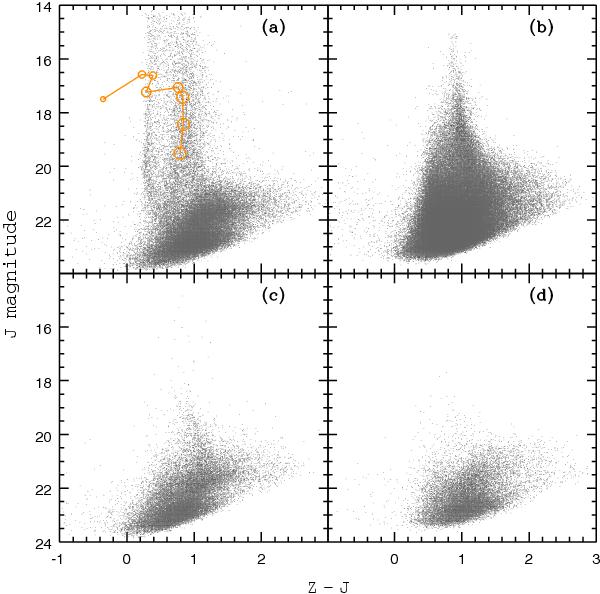
Observed CMDs for objects with different classifications from the reduction package: a) stellar sources on both filters (55025 points); b) extended sources in both filters (151924 points); c) stellar on the J and extended on the Z tile (27687 points); d) and extended on the J and stellar on the Z image (18932 points). In panel a) the open (orange) circles show the evolutionary path of a simple stellar population (SSP) model with metallicity Z = 0.008 as the population ages. The size of the circles increases with the age of the model plotted at (4, 10, 30, 100 and 300) Myr and at (1, 3 and 10) Gyr. The model was obtained using the CMD online tool by L. Girardi at stev.oapd.inaf.it/cmd, and refers to an SSP born with 105M⊙ of stars distributed between 0.1 and 100 M⊙ with a Salpeter IMF flattened below 0.5 M⊙.
Current usage metrics show cumulative count of Article Views (full-text article views including HTML views, PDF and ePub downloads, according to the available data) and Abstracts Views on Vision4Press platform.
Data correspond to usage on the plateform after 2015. The current usage metrics is available 48-96 hours after online publication and is updated daily on week days.
Initial download of the metrics may take a while.