Fig. 22
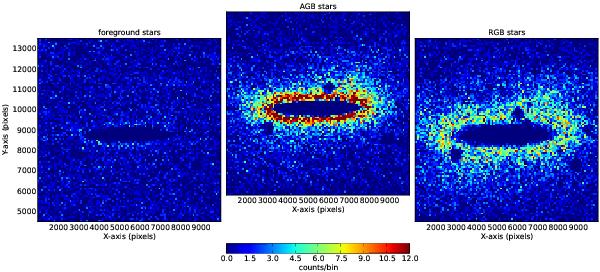
Stellar density distribution of NGC 253. For each plot, the stellar catalog has been binned to areas of 0.5 × 0.5 kpc (87.5 × 87.5 pixels) and the density of each class of object computed. The foreground population (left panel) shows a very uniform distribution with an average of 0.6 ± 0.8 stars per bin. The AGB stellar density (center panel) steeply increases toward the disk from background levels to a peak of 27 sources per bin. In contrast, the RGB stars (right panel) are more uniformly distributed around the disk and extend further out. The peak density of the RGB stars is 14 sources per bin.
Current usage metrics show cumulative count of Article Views (full-text article views including HTML views, PDF and ePub downloads, according to the available data) and Abstracts Views on Vision4Press platform.
Data correspond to usage on the plateform after 2015. The current usage metrics is available 48-96 hours after online publication and is updated daily on week days.
Initial download of the metrics may take a while.