Free Access
Fig. 20
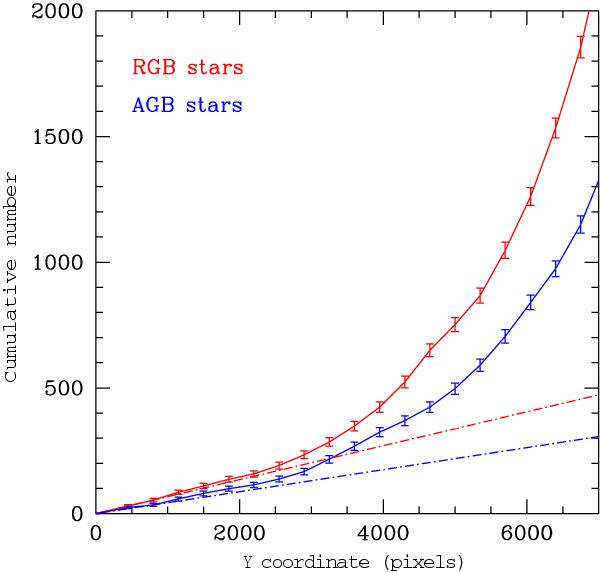
Solid lines: distribution of the RGB (upper) and AGB (lower) stars extracted from the statistically decontaminated catalog and located in the central portion of the tile (2500 ≤ X ≤ 8500). The error bars show the ± 1σ Poissonian uncertainty. Dash-dotted lines: straight lines fitting the distribution up to Y = 1000.
Current usage metrics show cumulative count of Article Views (full-text article views including HTML views, PDF and ePub downloads, according to the available data) and Abstracts Views on Vision4Press platform.
Data correspond to usage on the plateform after 2015. The current usage metrics is available 48-96 hours after online publication and is updated daily on week days.
Initial download of the metrics may take a while.