Fig. 2
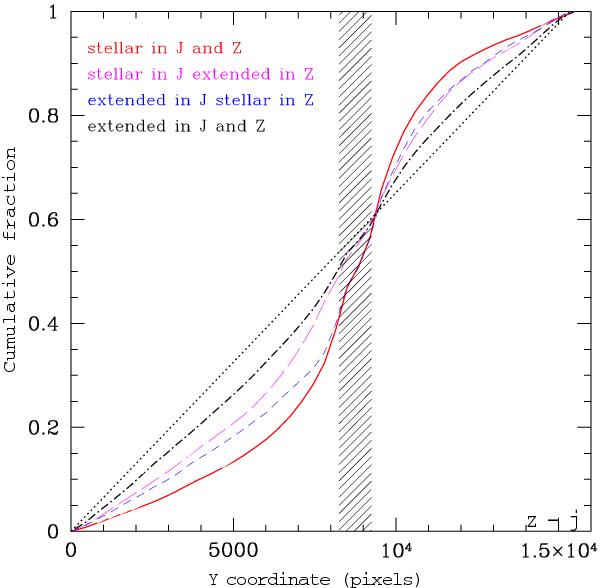
Cumulative distribution along the vertical coordinate of the VISTA tile for sources with different classifications on the VDFS catalog: stellar in both J and Z (solid red line), extended in both J and Z (dot-dashed black line), stellar in J and extended in Z (long-dashed magenta line), stellar in Z and extended in J (short-dashed blue line). A flat spatial distribution corresponds to a line at 45 degrees (dotted line). The hatched region indicates the location of the disk of NGC 253, where the surface brightness is too high to measure individual sources and number counts are heavily affected by crowding effects.
Current usage metrics show cumulative count of Article Views (full-text article views including HTML views, PDF and ePub downloads, according to the available data) and Abstracts Views on Vision4Press platform.
Data correspond to usage on the plateform after 2015. The current usage metrics is available 48-96 hours after online publication and is updated daily on week days.
Initial download of the metrics may take a while.