Fig. 19
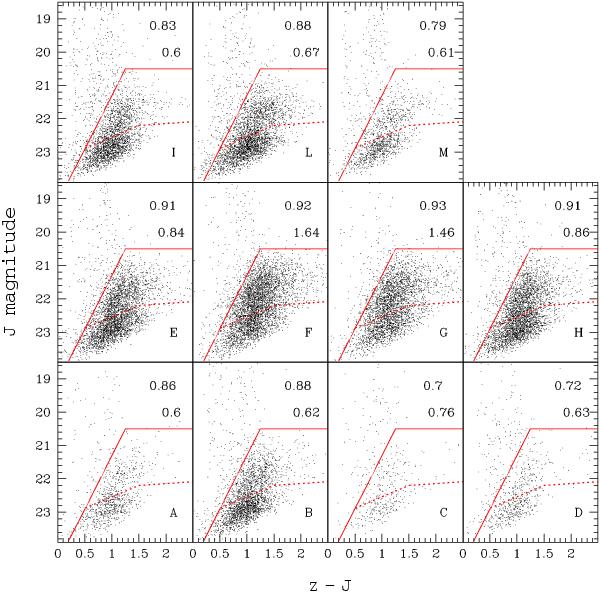
CMD of catalog A stars in subregions of the tile covering the outer disk of NGC 253, and shown in Fig. 5. The CMDs are identified with the same alphabetic letter as the subregions in the outer disk in Fig. 5. The solid line shows the selection criteria for star members of NGC 253; the dotted line shows the location of the tip of the RGB stars as a function of metallicity as in Fig. 6. The two numbers listed in the upper right corner of each panel indicate (uppermost) the fraction of NGC 253 star members over the total number of stars detected in the subregion (i.e. the same as reported in Fig. 11), and (lowermost) the ratio between the bright AGB stars (counted between the solid and dotted lines) and the RGB stars (counted below the dotted line). The fraction of AGB stars is a function of position in the tile and it increases as we come closer to the disk of NGC 253.
Current usage metrics show cumulative count of Article Views (full-text article views including HTML views, PDF and ePub downloads, according to the available data) and Abstracts Views on Vision4Press platform.
Data correspond to usage on the plateform after 2015. The current usage metrics is available 48-96 hours after online publication and is updated daily on week days.
Initial download of the metrics may take a while.