Fig. 17
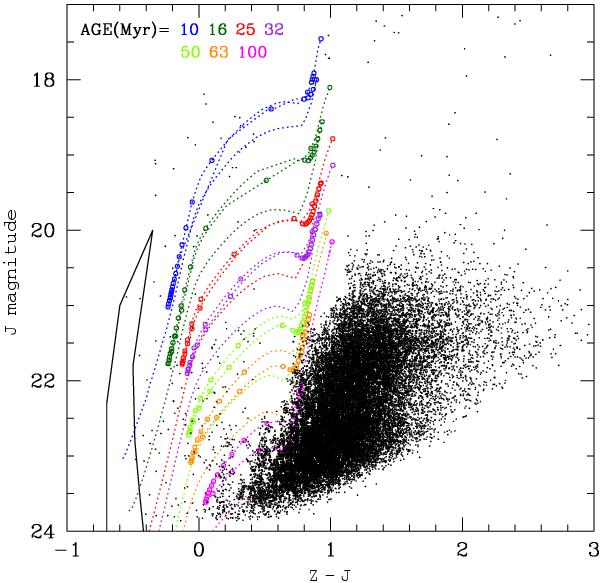
Statistically decontaminated CMD for catalog A with theoretical isochrones superimposed. The solid black line limits the region of the main sequence (MS) stars, while the dotted lines connect the isochrones of the post-MS evolution for different ages, i.e. for 100, 63, 50, 32, 25, 16 and 10 Myr (from bottom to top). The open circles show the position of 30 models equally spaced in evolutionary mass between the turn-off mass and the mass of the dying star. The density of these circles is thus proportional to the lifetime of the evolutionary subphase and indicate where the stars are more likely located.
Current usage metrics show cumulative count of Article Views (full-text article views including HTML views, PDF and ePub downloads, according to the available data) and Abstracts Views on Vision4Press platform.
Data correspond to usage on the plateform after 2015. The current usage metrics is available 48-96 hours after online publication and is updated daily on week days.
Initial download of the metrics may take a while.