Fig. 15
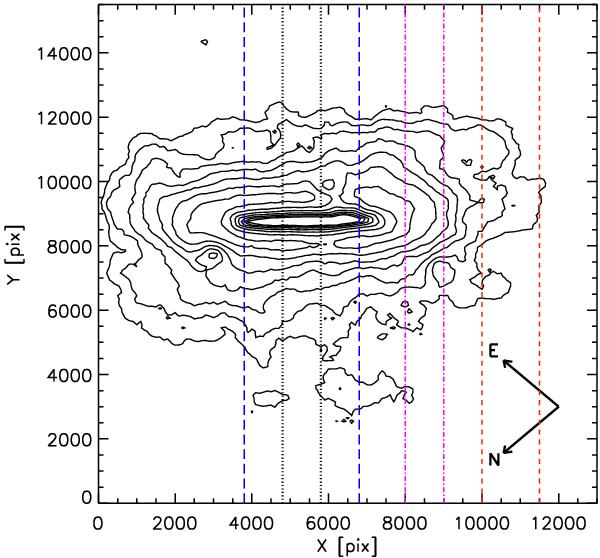
Isodensity contour levels for sources classified as stellar on both Z and J tiles, i.e. catalog A. Contours are plotted so that, going toward the inner regions, each contour has a 40% higher density with respect to the previous one. The outermost contour has a density of 0.23 × 10⁵ stars/deg2; the next has a density of 0.32 × 10⁵ stars/deg2 and so on. The vertical lines indicate the regions along the minor axis in which the profiles in Fig. 14 are computed.
Current usage metrics show cumulative count of Article Views (full-text article views including HTML views, PDF and ePub downloads, according to the available data) and Abstracts Views on Vision4Press platform.
Data correspond to usage on the plateform after 2015. The current usage metrics is available 48-96 hours after online publication and is updated daily on week days.
Initial download of the metrics may take a while.