Fig. 14
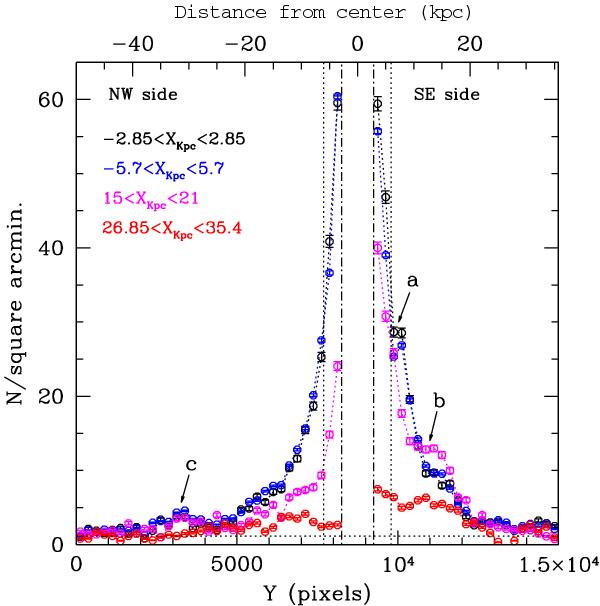
Surface density profiles for the catalog A likely members of NGC 253 (selected as in Fig. 12) along directions parallel to the minor axis within four stripes as labelled. Dot-dashed lines limit the central region of the tile, where photometry is affected by very high crowding. Dotted lines are drawn at ± 6 kpc from the galaxy’s major axis, showing the projected extension along the minor axis of the (circular) disk of the galaxy. Regions outside the dotted lines should not be dominated by stars from the thin disk component. The horizontal line shows the level of the foreground/background contamination as in Fig. 12. The arrows highlight the high density regions described in the text.
Current usage metrics show cumulative count of Article Views (full-text article views including HTML views, PDF and ePub downloads, according to the available data) and Abstracts Views on Vision4Press platform.
Data correspond to usage on the plateform after 2015. The current usage metrics is available 48-96 hours after online publication and is updated daily on week days.
Initial download of the metrics may take a while.