Fig. 13
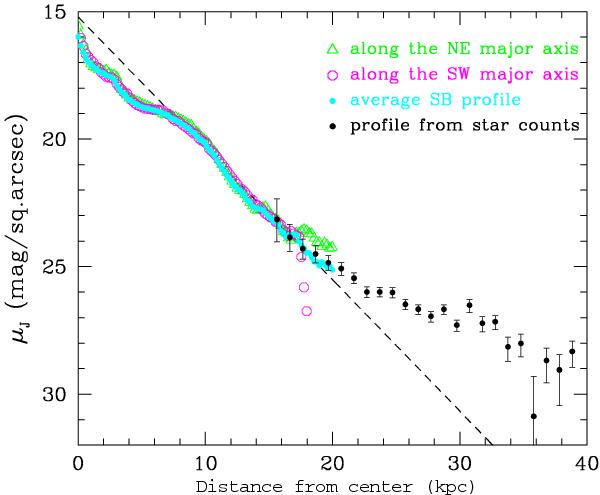
Composite surface brightness profile along the major axis of NGC 253. The green triangles and magenta circles show surface brightness profiles extracted along the North-East and South-West major axes directions from the J-band early commissioning data. Small light blue dots trace the average J-band surface brightness profile. Small black dots are the number density profile of star members of NGC 253, corrected for crowding effects, and scaled to the surface brightness profile between 15–18 arcmin from the center. The error bars are Poissonian from counts and also include the foreground/background estimated errors. The dashed line (not a fit) helps to better see the continuity of the surface brightness and scaled number density profiles.
Current usage metrics show cumulative count of Article Views (full-text article views including HTML views, PDF and ePub downloads, according to the available data) and Abstracts Views on Vision4Press platform.
Data correspond to usage on the plateform after 2015. The current usage metrics is available 48-96 hours after online publication and is updated daily on week days.
Initial download of the metrics may take a while.