Fig. 12
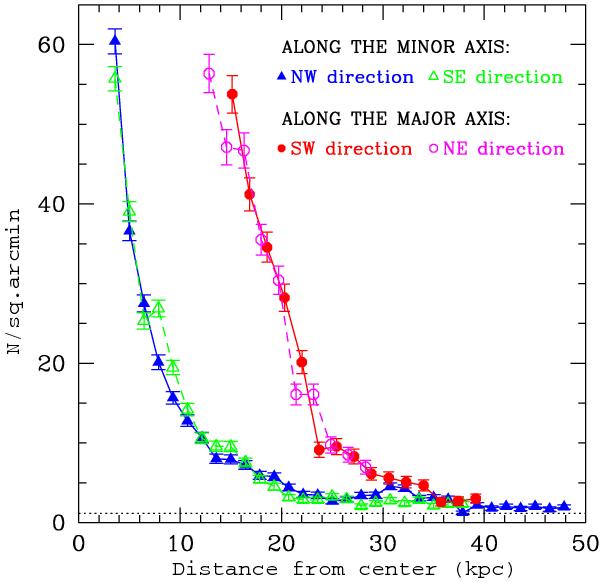
Surface density profiles along the major and minor axis of the NGC 253 disk, as labelled. The profiles are constructed from catalog A, considering only probable members of NGC 253 (stars below the solid line in Fig. 6), and the error bars show the ± 1σ Poissonian uncertainty. The star counts along the major axis are performed within a horizontal stripe defined by 8250 ≤ Y ≤ 9250 pixels, corresponding to a width of ≃5.7 kpc. The central region is excluded due to crowding. The minor axis profiles are extracted from a stripe at 3800 ≤ X ≤ 6800 pixels. At a distance of ≃35 kpc from the center the number density is nearly the same in the two orthogonal directions. The dotted black line shows the density of foreground/background objects measured on subregions 1+4 in Fig. 11 in the same selected part of the CMD.
Current usage metrics show cumulative count of Article Views (full-text article views including HTML views, PDF and ePub downloads, according to the available data) and Abstracts Views on Vision4Press platform.
Data correspond to usage on the plateform after 2015. The current usage metrics is available 48-96 hours after online publication and is updated daily on week days.
Initial download of the metrics may take a while.