Fig. 11
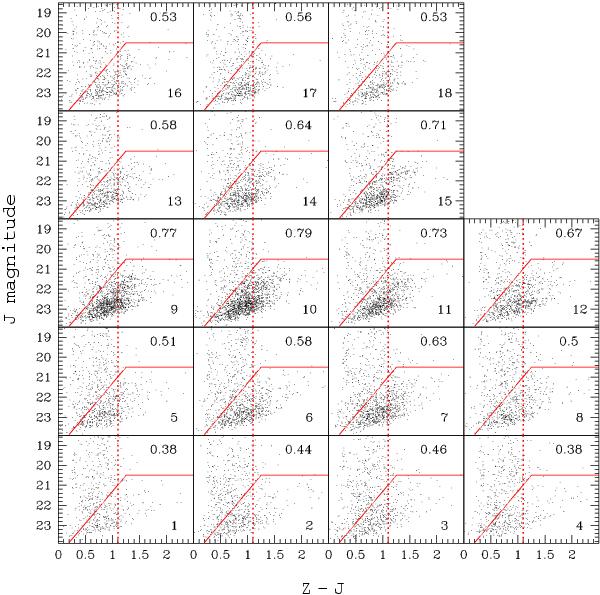
Spatially resolved CMDs over the VISTA tile (halo regions). Each panel shows the CMD of the stars falling in a rectangular subregion labelled in the bottom right corner with the same number as in Fig. 5. The solid line shows the dividing line of the likely members of NGC 253, as in Fig. 6. The number in the upper right corner is the ratio between the stars below this envelope and the total number of stars in the selected region of the tile. Notice that the CMDs are plotted only up to J = 18, while stars are measured up to J = 14. The vertical dotted line at Z − J = 1.1 marks the color at which the NGC 253 stellar population greatly outnumbers the foreground contamination (see Fig. 9).
Current usage metrics show cumulative count of Article Views (full-text article views including HTML views, PDF and ePub downloads, according to the available data) and Abstracts Views on Vision4Press platform.
Data correspond to usage on the plateform after 2015. The current usage metrics is available 48-96 hours after online publication and is updated daily on week days.
Initial download of the metrics may take a while.