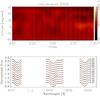
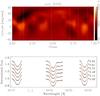
Fig. 1

Doppler images in July–August 2004 and July 2005. Upper panel of each pair: equirectangular projection of the surface temperature distribution obtained. Lower panel: observed (vertical lines, the height representing the errors in observations) and calculated line profiles (solid lines).
Current usage metrics show cumulative count of Article Views (full-text article views including HTML views, PDF and ePub downloads, according to the available data) and Abstracts Views on Vision4Press platform.
Data correspond to usage on the plateform after 2015. The current usage metrics is available 48-96 hours after online publication and is updated daily on week days.
Initial download of the metrics may take a while.