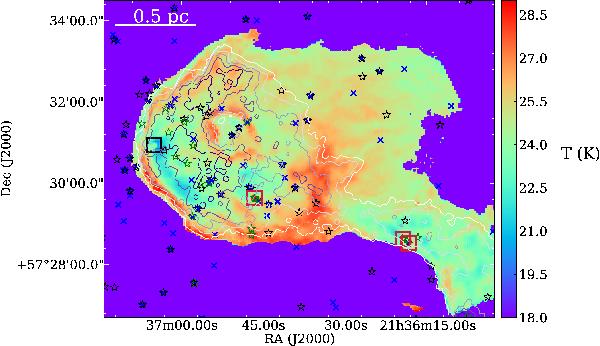
Fig. 5

Temperature map for IC 1396 A (see text). The contours mark the 10, 20, 30, 40, 50 K km s-1 levels of the integrated CO(3−2) emission from archival JCMT data. The black stars denote Class II and Class III objects from Sicilia-Aguilar et al. (2005, 2006a,b), Morales-Calderón et al. (2009), and Getman et al. (2012). The green stars are Class I objects from Sicilia-Aguilar et al. (2006a) and Reach et al. (2004). The blue X symbols correspond to X-ray detections consistent with YSO from Getman et al. (2012). The objects discussed in this work are marked as large squares (black for Class 0 objects, red for Class I objects). Note that due to the exclusion of pixels with low fluxes (see text), the only significant temperatures are those inside the globule and not those in the external parts that appear violet in the image.
Current usage metrics show cumulative count of Article Views (full-text article views including HTML views, PDF and ePub downloads, according to the available data) and Abstracts Views on Vision4Press platform.
Data correspond to usage on the plateform after 2015. The current usage metrics is available 48-96 hours after online publication and is updated daily on week days.
Initial download of the metrics may take a while.


