Fig. 9
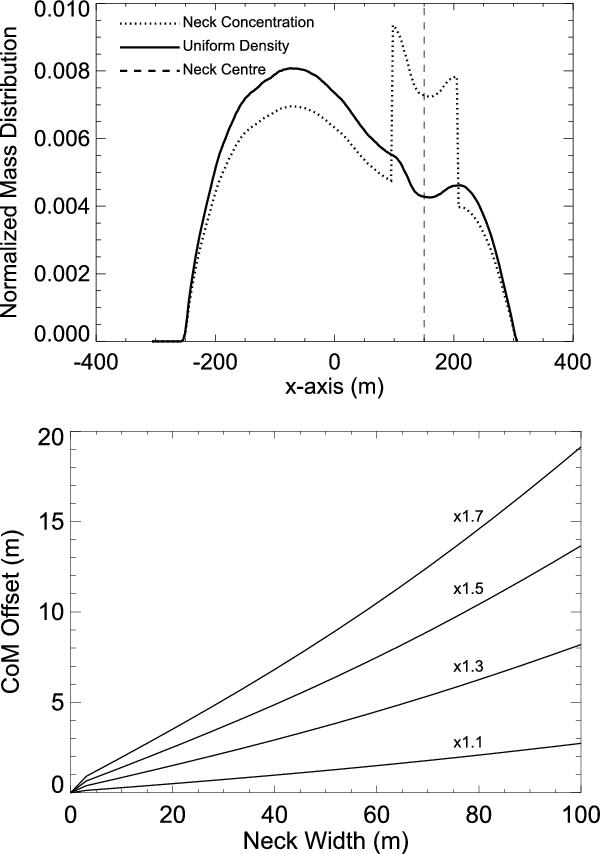
Analysis of a compressed “neck” region between the “body” and “head” of Itokawa to explain the centre-of-mass (COM) offset. Top Panel – The normalised mass distribution along Itokawa’s x-axis. The solid line is for uniform density, and the dotted line is for the extreme case of the same overall mass but with a neck of diameter 100 m and density defined by a neck-density multiple of 1.7 times the overall bulk density. The vertical dashed line indicates the location of the centre of the neck defined by the minimum in the mass distribution. Bottom Panel – The COM offset as a function of neck width and neck-density multiple. A multiple of 1.7 corresponds to a density equal to that of solid meteorites associated with S-type asteroids.
Current usage metrics show cumulative count of Article Views (full-text article views including HTML views, PDF and ePub downloads, according to the available data) and Abstracts Views on Vision4Press platform.
Data correspond to usage on the plateform after 2015. The current usage metrics is available 48-96 hours after online publication and is updated daily on week days.
Initial download of the metrics may take a while.