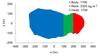
Fig. 6
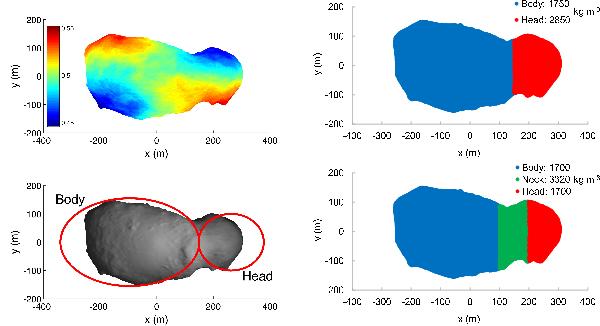
Various stages of the thermophysical analysis used to attempt to reconcile the observed YORP acceleration with theoretical determinations. The pole-on shape model renderings were determined from imaging data from the Hayabusa spacecraft (Gaskell 2008), and highlight Itokawa’s “bi-lobed” appearance (Demura et al. 2006). Upper Left Panel – Average surface roughness distribution of Itokawa clones that produce a YORP rotational acceleration (or YORP spin-up). The roughness scale ranges from 0.45 (blue) to 0.55 (red). Lower Left Panel – Regular ellipsoids that interface at x ~ 150 m, with relative dimensions chosen for consistency with Scheeres & Gaskell (2008), which are loosely based on values from Demura et al. (2006). A density differential between the head and body can explain the COM offset. Upper Right Panel – Use of the true shape model with the interface between “body” and “head” regions of different densities at x = 150 m. Lower Right Panel – A compressed “neck” region of higher density located between the “body” and “head” to explain the measured COM offset. See Sect. 4 for details.
Current usage metrics show cumulative count of Article Views (full-text article views including HTML views, PDF and ePub downloads, according to the available data) and Abstracts Views on Vision4Press platform.
Data correspond to usage on the plateform after 2015. The current usage metrics is available 48-96 hours after online publication and is updated daily on week days.
Initial download of the metrics may take a while.