Fig. 5
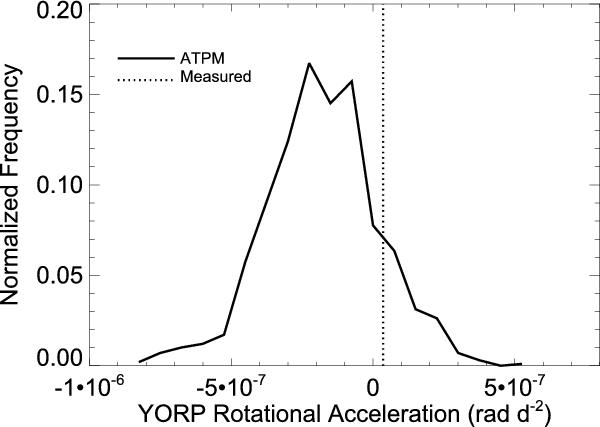
Distribution of YORP rotational acceleration values acting on Itokawa predicted by ATPM for different patchy surface roughness distributions (solid line) compared with the observed value (dotted line).
Current usage metrics show cumulative count of Article Views (full-text article views including HTML views, PDF and ePub downloads, according to the available data) and Abstracts Views on Vision4Press platform.
Data correspond to usage on the plateform after 2015. The current usage metrics is available 48-96 hours after online publication and is updated daily on week days.
Initial download of the metrics may take a while.