Fig. 4
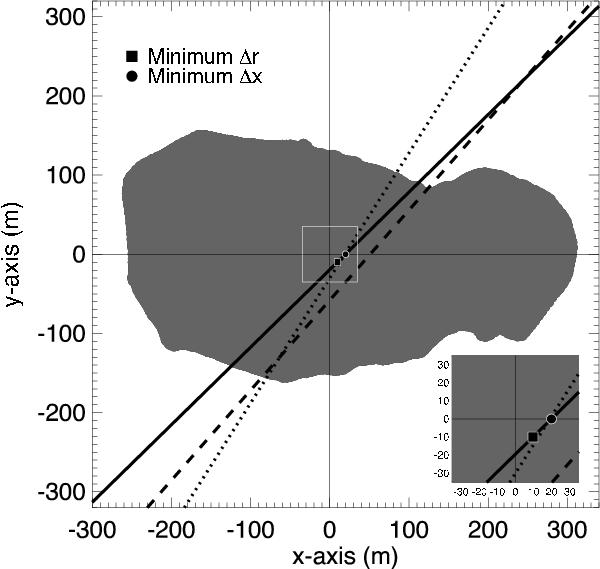
Projection in the x − y plane of Itokawa’s shape model and possible new locations of the centre-of-mass to reconcile the observed YORP effect with theory. Assuming a moderately rough surface with a uniform spatial distribution, the ATPM calculates that the COM must exist somewhere along the solid line to reproduce the observed YORP rotational acceleration of 3.54 × 10⁻⁸ rad day-2. The location with the minimum required offset from the centre-of-figure is shown by the black square (~14 m displacement), and the black circle shows the location if the offset is just along the x-axis (~21 m displacement). Locations further along the line are less probable as they require greater and more unusual bulk density inhomogeneities to produce the larger offsets. The ATPM calculates the YORP rotational acceleration line with shadowing and global self-heating effects included. For comparison purposes, the zero YORP rotational acceleration lines with none of these effects included (Scheeres & Gaskell 2008), and with only shadowing included (Breiter et al. 2009), are plotted as the dotted and dashed lines respectively. As demonstrated in Rozitis & Green (2013), if global self-heating effects are neglected then YORP predictions are generally more accurate if shadowing is also not included. This explains why the calculations by Scheeres & Gaskell (2008) are similar to ours as shown here.
Current usage metrics show cumulative count of Article Views (full-text article views including HTML views, PDF and ePub downloads, according to the available data) and Abstracts Views on Vision4Press platform.
Data correspond to usage on the plateform after 2015. The current usage metrics is available 48-96 hours after online publication and is updated daily on week days.
Initial download of the metrics may take a while.