Fig. 2
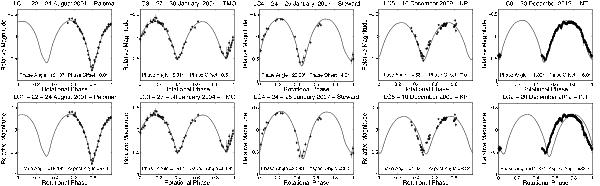
A representative sample of lightcurves generated using the convex model of Itokawa. The solid line represents the artificial lightcurves and the dots are the observed magnitude data points. In the upper panels, the model has been advanced with a rotation period changing due to YORP. In the the lower panels, the lightcurves are generated with a fixed period model. It is clear that there is a progressive increase in the rotation phase offset between the artificial lightcurves and observed data points when a fixed period model is used. Incorporating a linear change in rotation rate, consistent with YORP, corrects the rotational phase of the artificial lightcurves (also see Fig. 1).
Current usage metrics show cumulative count of Article Views (full-text article views including HTML views, PDF and ePub downloads, according to the available data) and Abstracts Views on Vision4Press platform.
Data correspond to usage on the plateform after 2015. The current usage metrics is available 48-96 hours after online publication and is updated daily on week days.
Initial download of the metrics may take a while.