Fig. 2
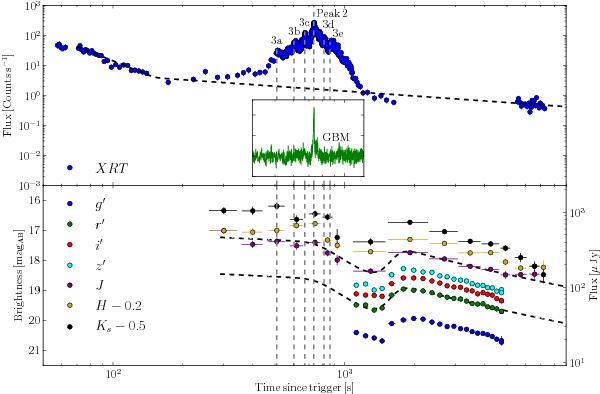
The X-ray (top) and optical/NIR (bottom) light curves of GRB 121217A with the inset graph showing the GBM prompt emission of the second peak. The canonical model of the X-ray emission can be seen as the black-dashed line in the top panel, where the flare, simultaneous to the second prompt peak, has been excluded from the fit (Sect. 3.3). The black-dashed line in the lower panel is the best-fit double broken power law of the afterglow emission (Sect. 3.4). Only the observations with a time less than T0 + 104 s have been included and the full light curve can be seen in Fig. A.1.
Current usage metrics show cumulative count of Article Views (full-text article views including HTML views, PDF and ePub downloads, according to the available data) and Abstracts Views on Vision4Press platform.
Data correspond to usage on the plateform after 2015. The current usage metrics is available 48-96 hours after online publication and is updated daily on week days.
Initial download of the metrics may take a while.