Free Access
Fig. 3
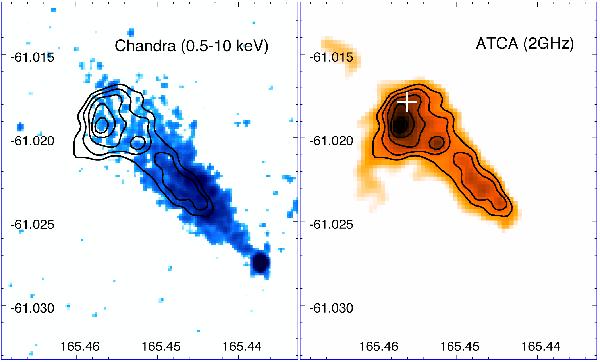
Chandra (left) and ATCA 2GHz (right) images of the PWN. The ATCA contours are overplotted on both images. On the right panel, a cross marks the position of the radio source as reported in the MGPS-2 survey (see text for details).
Current usage metrics show cumulative count of Article Views (full-text article views including HTML views, PDF and ePub downloads, according to the available data) and Abstracts Views on Vision4Press platform.
Data correspond to usage on the plateform after 2015. The current usage metrics is available 48-96 hours after online publication and is updated daily on week days.
Initial download of the metrics may take a while.