Fig. 2
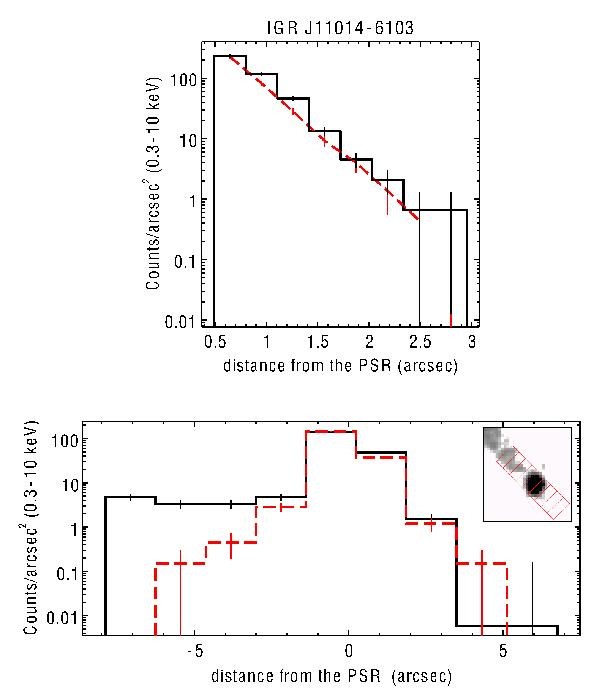
Top panel: radial profile within 3′′ from the source PSR (histogram in black) compared to the PSF (dashed red line) simulated with the ChaRT tool at the PSR position and with the measured energy spectrum. Bottom panel: same plot as above, but for the regions marked in the inset picture. Positive radial distances are in front of the source, in the SW direction, negative are backwards in the NE direction (i.e. in the direction of the PWN).
Current usage metrics show cumulative count of Article Views (full-text article views including HTML views, PDF and ePub downloads, according to the available data) and Abstracts Views on Vision4Press platform.
Data correspond to usage on the plateform after 2015. The current usage metrics is available 48-96 hours after online publication and is updated daily on week days.
Initial download of the metrics may take a while.