Free Access
Fig. 9
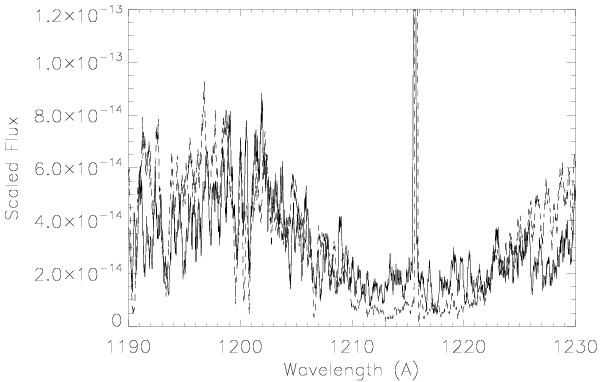
Comparison of the Lyα line from the day 23 (solid) and day 617 (dash) spectra. The latter was scaled by a factor of 3 in continuum flux for epoch. Note the invariance of the wings of the profile, consistent with only an interstellar contribution throughout the UV spectral sequence. The emission spike is geocoronal Lyα.
Current usage metrics show cumulative count of Article Views (full-text article views including HTML views, PDF and ePub downloads, according to the available data) and Abstracts Views on Vision4Press platform.
Data correspond to usage on the plateform after 2015. The current usage metrics is available 48-96 hours after online publication and is updated daily on week days.
Initial download of the metrics may take a while.