Fig. 33
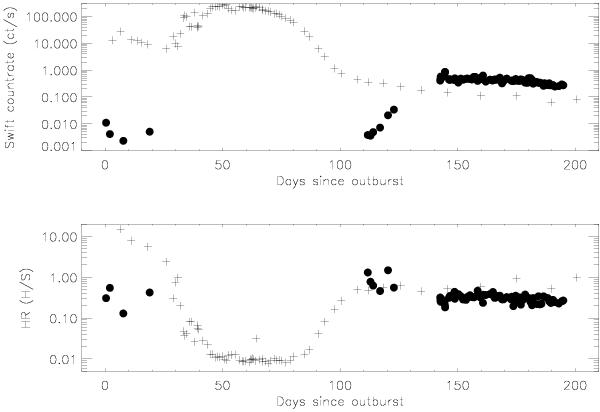
Top: comparative Swift/XRT light curves of RS Oph 2006 (cross) and T Pyx 2011 (dot) until day 200 after outburst for both. Bottom: hardness ratio showing that the supersoft phase was not seen for the T Pyx observations, the optical depth in the soft XRs completely obscured the white dwarf (see text for discussion). The H/S ratio for T Pyx used (0.8–10 keV)/(0.3–0.8 keV). For RS Oph we used the data in Schwarz et al. (2011) with the H/S ratio defined by (1–10 keV)/(0.3–1 keV).
Current usage metrics show cumulative count of Article Views (full-text article views including HTML views, PDF and ePub downloads, according to the available data) and Abstracts Views on Vision4Press platform.
Data correspond to usage on the plateform after 2015. The current usage metrics is available 48-96 hours after online publication and is updated daily on week days.
Initial download of the metrics may take a while.