Free Access
Fig. 31
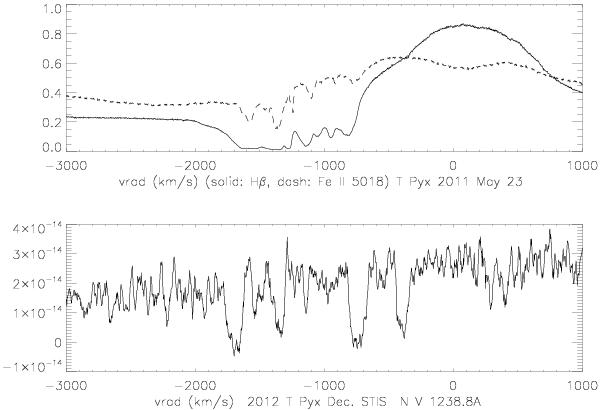
Comparison of early optical spectral line profiles (day 33, Hβ and Fe II 5018 Å) near maximum optical brightness with the day 617 STIS spectrum at N V 1238, 1242 Å absorption lines. As for Si IV, there was a component at –1300 km s-1 but there is no corresponding absorption at the higher velocity Si IV feature.
Current usage metrics show cumulative count of Article Views (full-text article views including HTML views, PDF and ePub downloads, according to the available data) and Abstracts Views on Vision4Press platform.
Data correspond to usage on the plateform after 2015. The current usage metrics is available 48-96 hours after online publication and is updated daily on week days.
Initial download of the metrics may take a while.