Free Access
Fig. 22
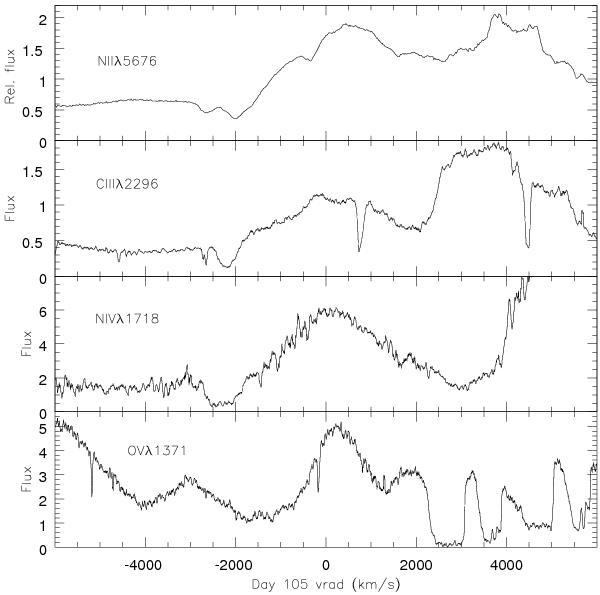
P Cyg profiles for the excited state transitions from day 105; from top: N II 5676 Å (ESO day 73, shown for comparison), C III 2296 Å, N IV 1718 Å, O V 1371 Å. The feature on the C III profile at ≈+800 km s-1 is an artifact of the join between echelle orders. The absolute fluxes are scaled by 10-12 erg s-1 cm-2 Å-1.
Current usage metrics show cumulative count of Article Views (full-text article views including HTML views, PDF and ePub downloads, according to the available data) and Abstracts Views on Vision4Press platform.
Data correspond to usage on the plateform after 2015. The current usage metrics is available 48-96 hours after online publication and is updated daily on week days.
Initial download of the metrics may take a while.