Fig. 6
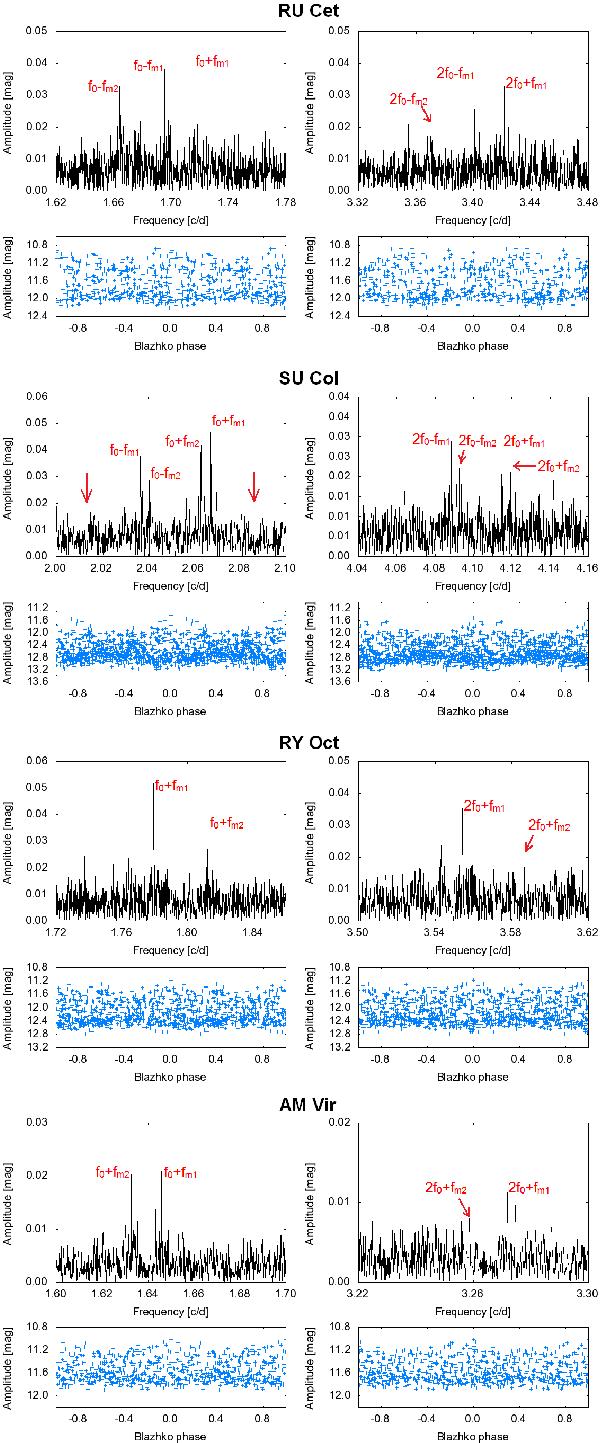
Four stars from our ASAS sample with double/irregular modulation. The first column depicts Fourier transform in the vicinity of f0 after prewhitening with the main pulsation components and data phased with period corresponding to fm1. There is the vicinity of 2f0 and phase plot according to the second modulation period (related to fm2) in the second column.
Current usage metrics show cumulative count of Article Views (full-text article views including HTML views, PDF and ePub downloads, according to the available data) and Abstracts Views on Vision4Press platform.
Data correspond to usage on the plateform after 2015. The current usage metrics is available 48-96 hours after online publication and is updated daily on week days.
Initial download of the metrics may take a while.