Fig. 4
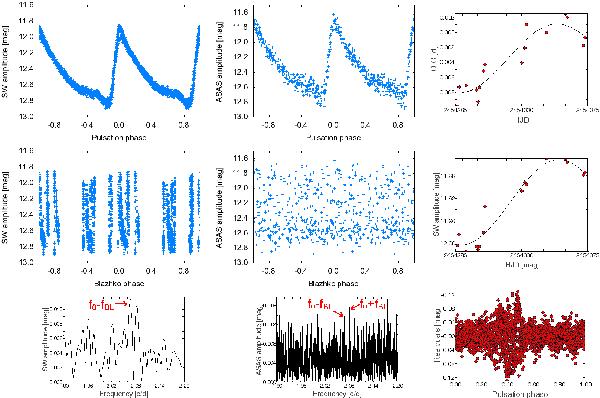
Analysis of HH Tel. First column shows cleaned SW data folded according to epoch 2454347.2643 with the main pulsation period P = 0.4820925 d (top panel) and with the Blazhko period 133 d (middle panel). Frequency spectrum based on SW data in the vicinity of f0 prewhitened with kf0 is shown in the bottom panel in the first column. Second column displays the same as the first one but for the ASAS data. In the third column (based on SW data again), there are from the top changes in O−C values, changes of maximum brightness, and residuals after prewhitening with the main pulsation components at the bottom (epoch is shifted of a half of a period for better arrangement). For details see the text in Sect. 3.2.
Current usage metrics show cumulative count of Article Views (full-text article views including HTML views, PDF and ePub downloads, according to the available data) and Abstracts Views on Vision4Press platform.
Data correspond to usage on the plateform after 2015. The current usage metrics is available 48-96 hours after online publication and is updated daily on week days.
Initial download of the metrics may take a while.