Fig. 3
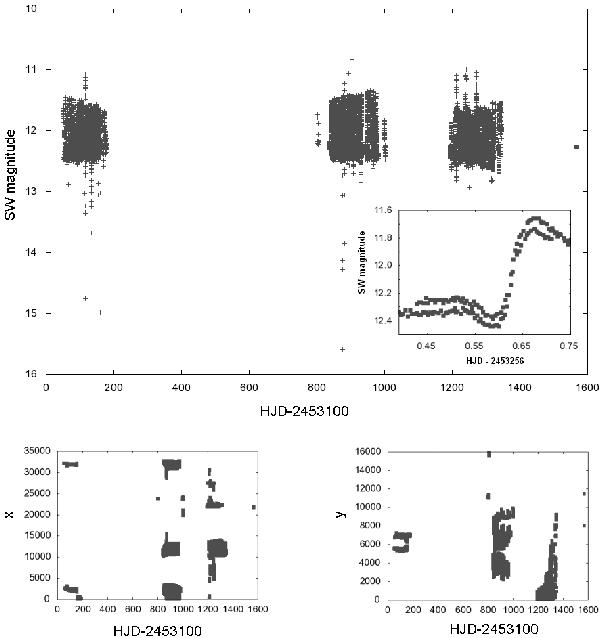
Illustration of difficulties in SW data processing on the case of DM And. The upper panel shows raw data. The change in amplitude of this star caused by the Blazko effect is apparent. The detail shows the night HJD 2 453 256, where the vertical shift between data coming from various cameras is demonstrated. The distribution of the positions of the star on the chip in x and y directions during the whole observation period are shown in the bottom part of this figure.
Current usage metrics show cumulative count of Article Views (full-text article views including HTML views, PDF and ePub downloads, according to the available data) and Abstracts Views on Vision4Press platform.
Data correspond to usage on the plateform after 2015. The current usage metrics is available 48-96 hours after online publication and is updated daily on week days.
Initial download of the metrics may take a while.