Fig. 2
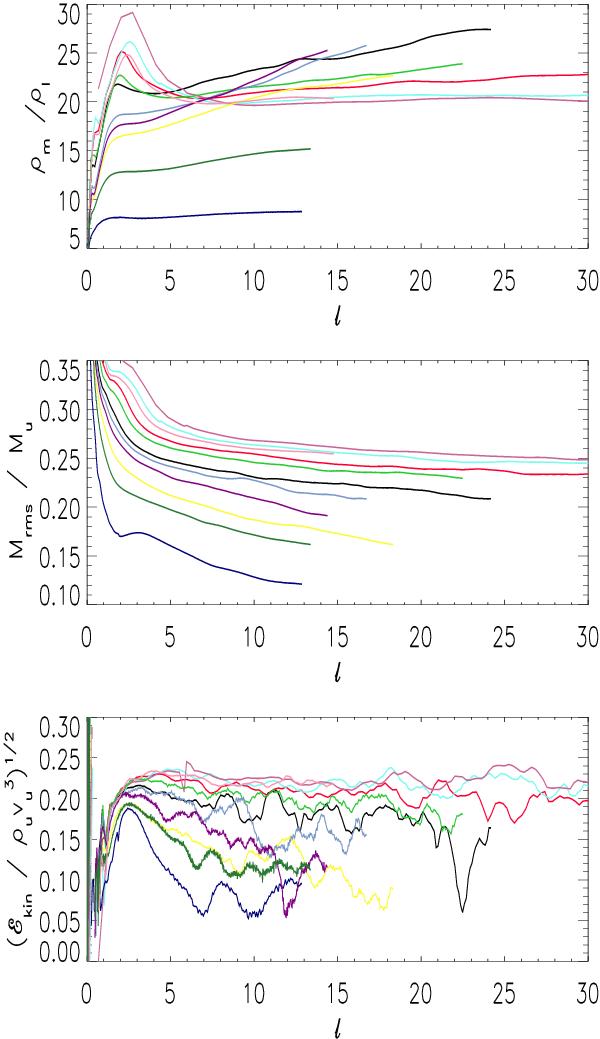
Mean density ρm (top panel),
root mean square Mach number Mrms (middle
panel), and  (bottom panel) as function of the monotonically increasing CDL
size ℓ for simulations R*_2. Individual curves
denote Mu = 2 (dark blue), 4 (dark
green), 5 (yellow), 7 (purple), 8 (light blue), 11 (black), 16 (green), 22 (red),
27 (pink), 33 (cyan), and 43 (magenta).
(bottom panel) as function of the monotonically increasing CDL
size ℓ for simulations R*_2. Individual curves
denote Mu = 2 (dark blue), 4 (dark
green), 5 (yellow), 7 (purple), 8 (light blue), 11 (black), 16 (green), 22 (red),
27 (pink), 33 (cyan), and 43 (magenta).
Current usage metrics show cumulative count of Article Views (full-text article views including HTML views, PDF and ePub downloads, according to the available data) and Abstracts Views on Vision4Press platform.
Data correspond to usage on the plateform after 2015. The current usage metrics is available 48-96 hours after online publication and is updated daily on week days.
Initial download of the metrics may take a while.