Fig. 11
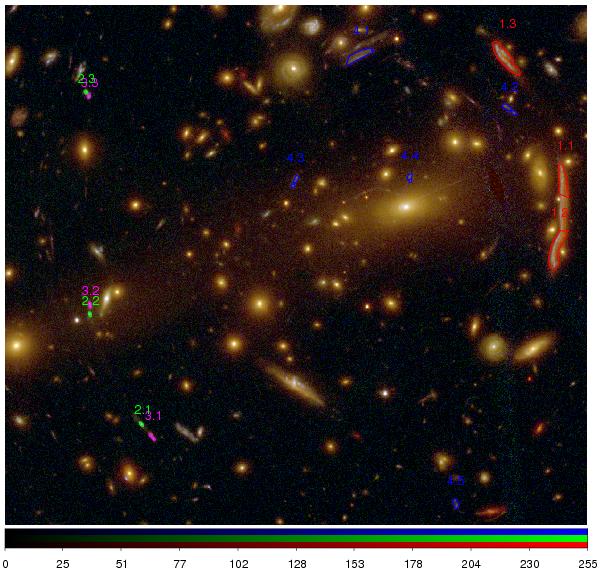
Galaxy cluster MACS1206 at z ~ 0.44 in a combination of optical filters from the CLASH/HST observations (blue = F435W + F475W, green = F606W + F625W + F775W + F814W + F850LP red = F105W + F110W + F125W + F140W + F160W). We show the strongly lensed multiple images described in Zitrin et al. (2012) for which we have spec-z. Systems 1–3 are highlighted in red, green, and blue, respectively. The image segmentation in these cases has been defined manually to optimize the reliability of the arc photometry. North is up, east is to the left. The pixel flux levels are given by the colour bar.
Current usage metrics show cumulative count of Article Views (full-text article views including HTML views, PDF and ePub downloads, according to the available data) and Abstracts Views on Vision4Press platform.
Data correspond to usage on the plateform after 2015. The current usage metrics is available 48-96 hours after online publication and is updated daily on week days.
Initial download of the metrics may take a while.