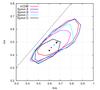
Fig. 5
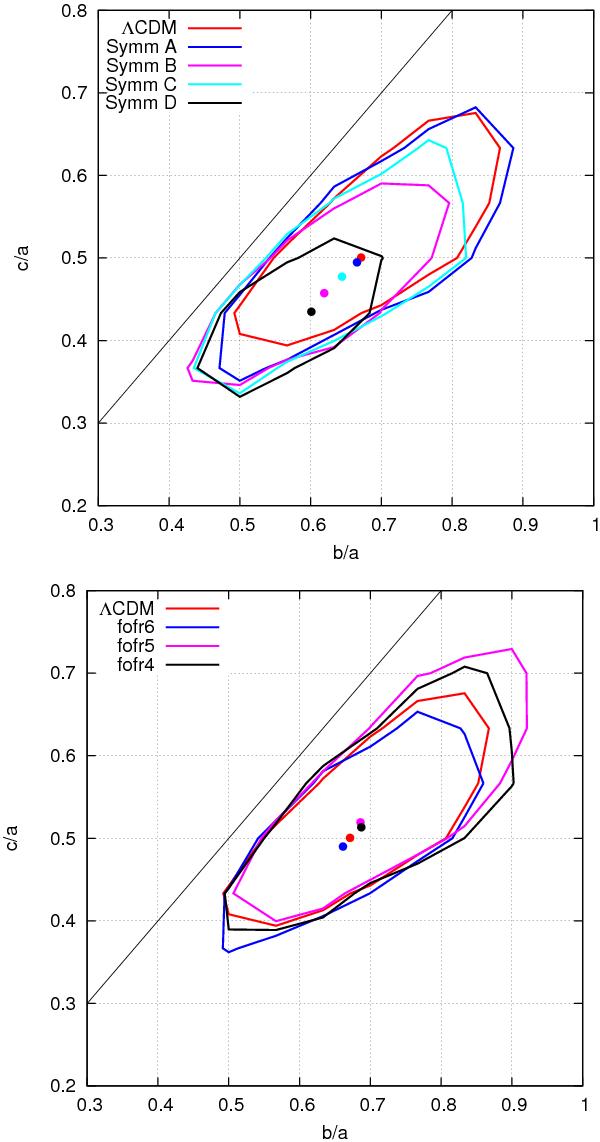
Contours of the distribution of ratios between semi-axis for the symmetron (left) and f(R) (right) simulations. Both panels also include the ΛCDM simulation for comparison. The points are the expected values of the distributions. The size of the error bars of these are comparable to the size of the points and are not included in the plot.
Current usage metrics show cumulative count of Article Views (full-text article views including HTML views, PDF and ePub downloads, according to the available data) and Abstracts Views on Vision4Press platform.
Data correspond to usage on the plateform after 2015. The current usage metrics is available 48-96 hours after online publication and is updated daily on week days.
Initial download of the metrics may take a while.