Fig. 2
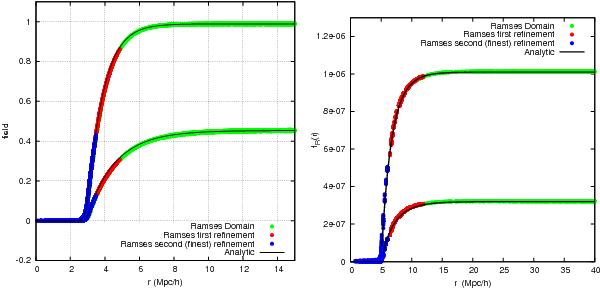
Left: comparison between analytical and numerical solutions of the symmetron model for two different redshifts. The density distribution is given by a sphere of constant density. Different colours correspond to different levels of refinement. The thin line is the analytic solution for redshift z = 0 (upper line) and z = 1 (lower line). Right: same for the f(R) solver. See text for details.
Current usage metrics show cumulative count of Article Views (full-text article views including HTML views, PDF and ePub downloads, according to the available data) and Abstracts Views on Vision4Press platform.
Data correspond to usage on the plateform after 2015. The current usage metrics is available 48-96 hours after online publication and is updated daily on week days.
Initial download of the metrics may take a while.