Fig. 9
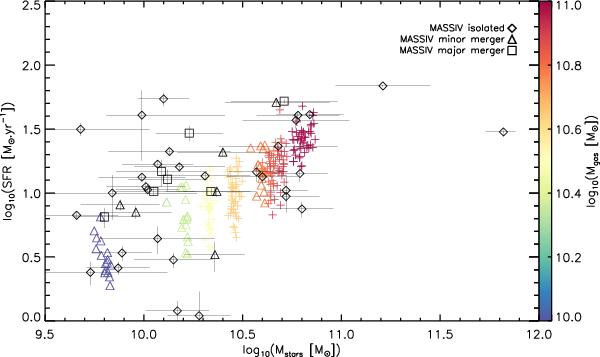
Star formation rate as a function of stellar mass measured between the coalescence and 800 Myr for the merger simulations, and between 200 and 800 Myr for the isolated simulations. Black symbols show MASSIV data for which the SFR is estimated from the Hα integrated luminosity, and the stellar masses measured within the optical radius ropt = 3.2 × rstars. Each colored symbol shows a snapshot of the MIRAGE mergers and isolated disks simulations, respectively plotted with “+” and “Δ”. The color encodes the gas mass of the disks and remnants measured within the gas optical radius.
Current usage metrics show cumulative count of Article Views (full-text article views including HTML views, PDF and ePub downloads, according to the available data) and Abstracts Views on Vision4Press platform.
Data correspond to usage on the plateform after 2015. The current usage metrics is available 48-96 hours after online publication and is updated daily on week days.
Initial download of the metrics may take a while.