Fig. 9
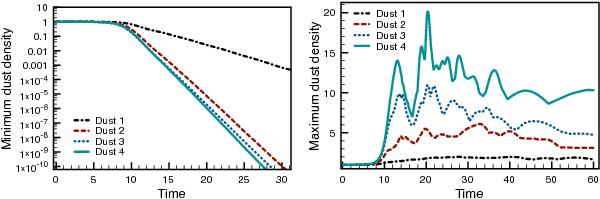
Left: evolution of the global minimum in dust density with time for all 4 dust fluids in a simulation with δ = 0.01 and κ = 0.7968. The size of the assumed particles in the fluid increases from dust 1 to 4. After the end of the linear phase (t ~ 10), the global minimum decreases exponentially. The decrease is faster for heavier dust particles. Only the part of the simulation is shown, where all minima are above the allowed minimum density (see Sect. 2.1). Right: global maximum for the four dust species. Density increases are stronger for heavier dust species.
Current usage metrics show cumulative count of Article Views (full-text article views including HTML views, PDF and ePub downloads, according to the available data) and Abstracts Views on Vision4Press platform.
Data correspond to usage on the plateform after 2015. The current usage metrics is available 48-96 hours after online publication and is updated daily on week days.
Initial download of the metrics may take a while.