Fig. 8
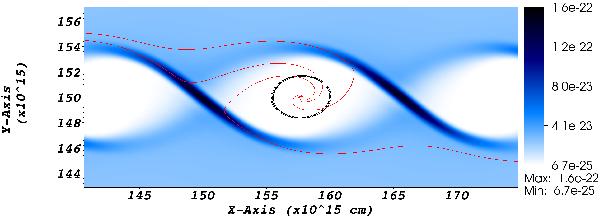
Density distribution of the largest dust grains out of four species at t = 10 in a 2D simulation with δ = 0.01 and κ = 0.7968. Only part of the simulated domain is shown. In the centre of the middle vortex, the black ellipse is a streamline of the gas fluid. The gas trajectory is (almost) closed as the gas fluid is pressure supported by the lower pressure in the centre of the vortex. By contrast, the streamlines of the large dust particles (shown in red) can be seen to spiral out of the vortex. Ultimately, the dust ends up in two layers below and above the vortex structures.
Current usage metrics show cumulative count of Article Views (full-text article views including HTML views, PDF and ePub downloads, according to the available data) and Abstracts Views on Vision4Press platform.
Data correspond to usage on the plateform after 2015. The current usage metrics is available 48-96 hours after online publication and is updated daily on week days.
Initial download of the metrics may take a while.