Fig. 4
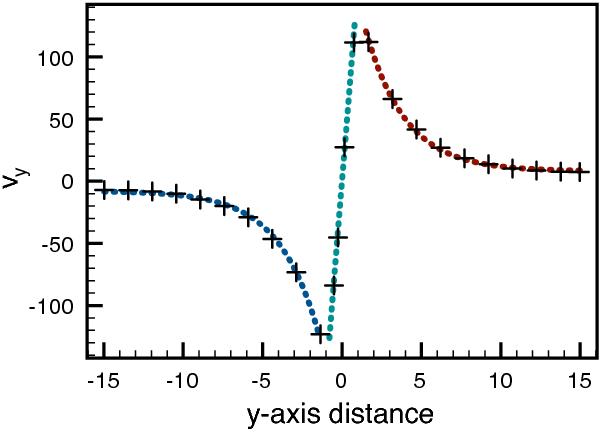
Comparison of the values of vy of a simulation (+ symbols) and the derived eigenfunctions (dotted lines) on a cut perpendicular to the flow direction. For clarity, only a limited amount of simulated points is shown, The values of vy are given in cm s-1. The cut, taken at t = 3, only spans a small portion of the range along the y-axis, and is centred on the middle of the boundary layer. The distance from the centre is given in units of D. The dotted lines each represent a solution of the eigenfunction, the red line in the upper flow, teal in the middle layer, and blue in the lower flow. From the correspondence with the simulated values, it is clear that during the perpendicular velocity the linear phase evolves from the perturbation in Eq. (8) to the distribution expected from the analytical derivation of the eigenfunction.
Current usage metrics show cumulative count of Article Views (full-text article views including HTML views, PDF and ePub downloads, according to the available data) and Abstracts Views on Vision4Press platform.
Data correspond to usage on the plateform after 2015. The current usage metrics is available 48-96 hours after online publication and is updated daily on week days.
Initial download of the metrics may take a while.