Free Access
Fig. 2
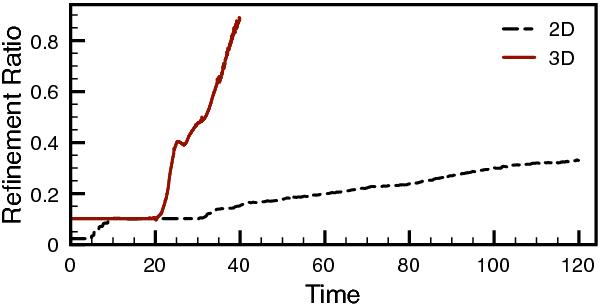
Evolution of the ratio between the actual amount of cells in a simulation and the amount needed to fill a uniform grid with the same resolution. The difference between the 2D and 3D setup are due to differences in the extent of the simulated domain.
Current usage metrics show cumulative count of Article Views (full-text article views including HTML views, PDF and ePub downloads, according to the available data) and Abstracts Views on Vision4Press platform.
Data correspond to usage on the plateform after 2015. The current usage metrics is available 48-96 hours after online publication and is updated daily on week days.
Initial download of the metrics may take a while.