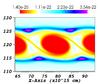
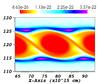
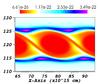
Fig. A.1
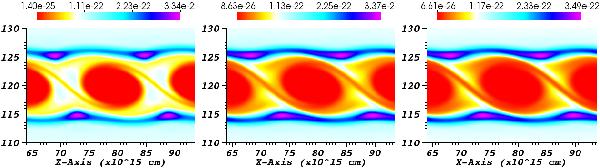
The summation of the densities for all the different dust species gives us the total dust density, as shown here for a simulation with two dust species (left panel), four dust species (central panel), and eight dust species (right panel). Only part of the larger domain of (1.58 × 2.4) × 1017 cm is shown. While the structures in the simulations with four and eight species are similar, the simulations with only two dust species display a less diffusive structure. The rarefaction rate is also underestimated in the simulation with two species, leading to higher minimum densities than in the two other cases. This is due to lower values of the largest represented dust species.
Current usage metrics show cumulative count of Article Views (full-text article views including HTML views, PDF and ePub downloads, according to the available data) and Abstracts Views on Vision4Press platform.
Data correspond to usage on the plateform after 2015. The current usage metrics is available 48-96 hours after online publication and is updated daily on week days.
Initial download of the metrics may take a while.