Fig. 18
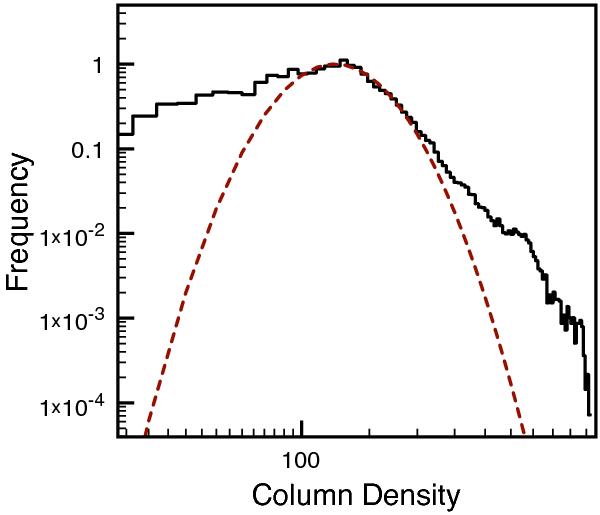
Column density distribution of the synthetic observation of the KHI on the right side of Fig. 17 at t = 40, as shown in black. The column density is shown in code units. The central part of the distribution is fitted with a log-normal distribution, as shown as the dashed red line. A power-law tail is seen on the high-density side, as well as an additional excess on the low-density side, which is comparable to what is seen in some observations of molecular clouds.
Current usage metrics show cumulative count of Article Views (full-text article views including HTML views, PDF and ePub downloads, according to the available data) and Abstracts Views on Vision4Press platform.
Data correspond to usage on the plateform after 2015. The current usage metrics is available 48-96 hours after online publication and is updated daily on week days.
Initial download of the metrics may take a while.