Fig. 17
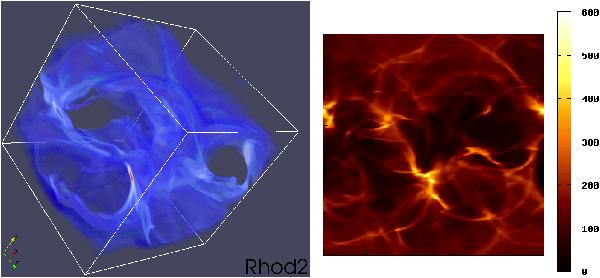
Left: volume plot of a simulation of the KHI at t = 40. The heaviest dust species (of two species) is shown with the opacity in the plot scaled with the dust density. One can clearly see the elongated, filamentary structures with several high-density clumps where the density has increased to more than 10 times its value. In between, the structures are vacuum bubbles where the density has decreased by several orders of magnitude. Right: line of sight surface density of the heaviest dust species, as derived from the 3D simulation on the left. The density scale is in code units. Elongated structures with embedded high-density clumps are clearly seen.
Current usage metrics show cumulative count of Article Views (full-text article views including HTML views, PDF and ePub downloads, according to the available data) and Abstracts Views on Vision4Press platform.
Data correspond to usage on the plateform after 2015. The current usage metrics is available 48-96 hours after online publication and is updated daily on week days.
Initial download of the metrics may take a while.