Fig. 16
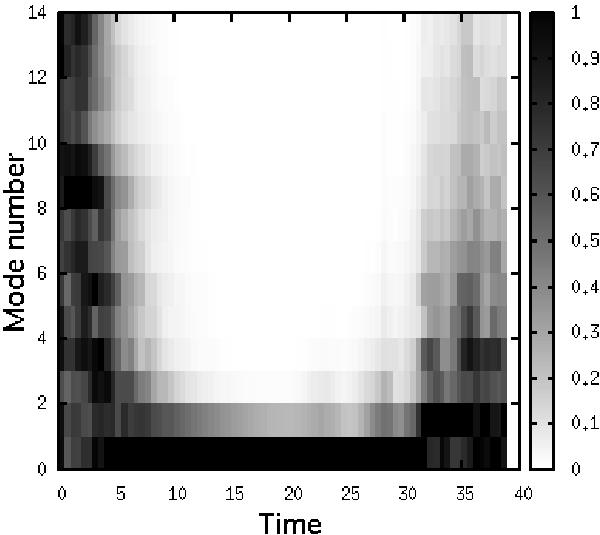
Comparison of the strength of each mode of vy along the z-direction of the middle plane. Modes 0 to 13 are shown. At each time, the strength of each mode is compared to the strength of the dominant mode at that time. Three distinct regimes can be discerned in the figure. Initially, the initial random perturbations evolve up to t ~ 8 from small-scale structures to a large scale feature. In the linear phase and the early non-linear phase (between t ~ 8 and t ~ 30), the vortex tubes are elongated along the z-direction and the 0-mode is dominant. After t ~ 30, the vortex tubes become unstable, resulting in the formation of small-scale structures.
Current usage metrics show cumulative count of Article Views (full-text article views including HTML views, PDF and ePub downloads, according to the available data) and Abstracts Views on Vision4Press platform.
Data correspond to usage on the plateform after 2015. The current usage metrics is available 48-96 hours after online publication and is updated daily on week days.
Initial download of the metrics may take a while.