Fig. 14
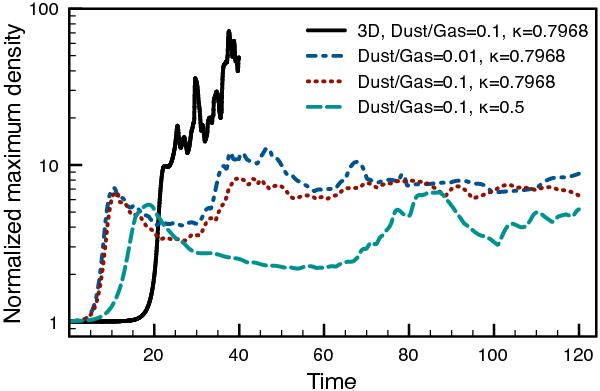
Comparison of the dust enhancement in four different simulations with different values of δ. The graph shows the maximum of the dust density in the simulation, ascompared to the initial value of the dust density. Dust enhancements are (initially) slightly higher for lower values of δ. The enhancements in the 3D case are significantly stronger due to the additional instability of the vortex tubes in the added third dimension. A log-scale is used for the maximum density. Note that the maximum density starts to increase at a later time in the 3D simulation as compared to the 2D cases because a random initial perturbation is used in 3D.
Current usage metrics show cumulative count of Article Views (full-text article views including HTML views, PDF and ePub downloads, according to the available data) and Abstracts Views on Vision4Press platform.
Data correspond to usage on the plateform after 2015. The current usage metrics is available 48-96 hours after online publication and is updated daily on week days.
Initial download of the metrics may take a while.