Fig. 12
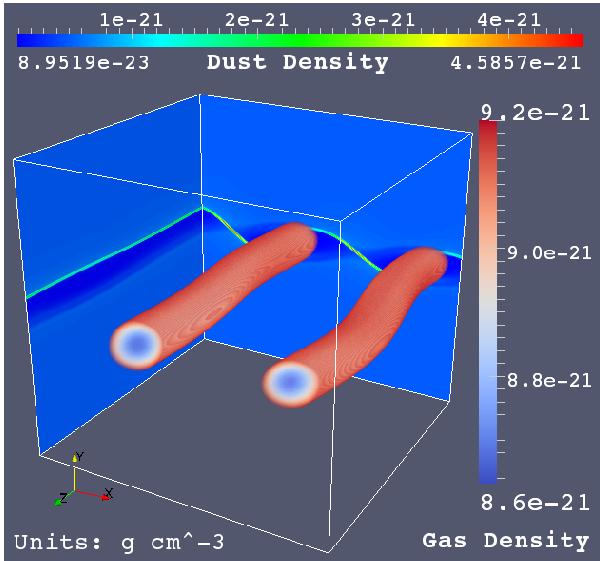
Volume rendering after the end of the linear phase (t = 22.5). The entire domain of the simulation is shown. The volume rendering shows the gas distribution of the two straight vortex-tubes that have formed. To visualize the vortices in the volume rendering, we only show gas densities below 9.2 × 10⁻²¹ g cm-3. At the back and left side of the cube (xy- and yz-planes, respectively), the dust distribution of the heaviest dust species is shown. The dust forms tubes around the gas vortices, and sheets of increased density between the tubes.
Current usage metrics show cumulative count of Article Views (full-text article views including HTML views, PDF and ePub downloads, according to the available data) and Abstracts Views on Vision4Press platform.
Data correspond to usage on the plateform after 2015. The current usage metrics is available 48-96 hours after online publication and is updated daily on week days.
Initial download of the metrics may take a while.