Fig. 11
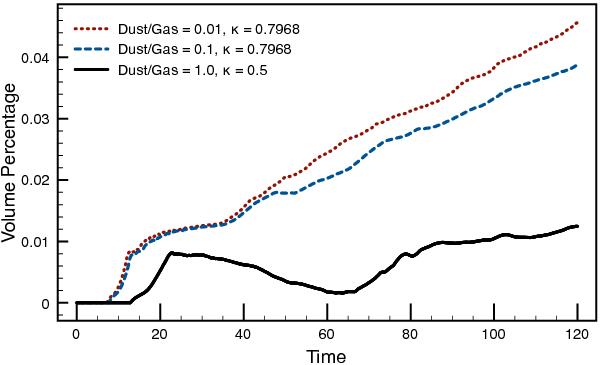
Volume percentage of the simulated domain where the dust density has at least increased to 2.5 times the initial dust density. All simulations have v0 = 0.42 and are perturbed with wavelengths close to their most unstable value (see Fig. 5). The portion of the domain where the dust density is significantly enhanced is seen to increase linearly with time after the linear phase (t ~ 10 for δ = 0.01 and δ = 0.1 and t ~ 20 for δ ~ 1.0). The rate of increase decreases with dust-to-gas ratio δ.
Current usage metrics show cumulative count of Article Views (full-text article views including HTML views, PDF and ePub downloads, according to the available data) and Abstracts Views on Vision4Press platform.
Data correspond to usage on the plateform after 2015. The current usage metrics is available 48-96 hours after online publication and is updated daily on week days.
Initial download of the metrics may take a while.