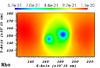
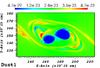
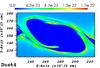
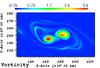
Fig. 10
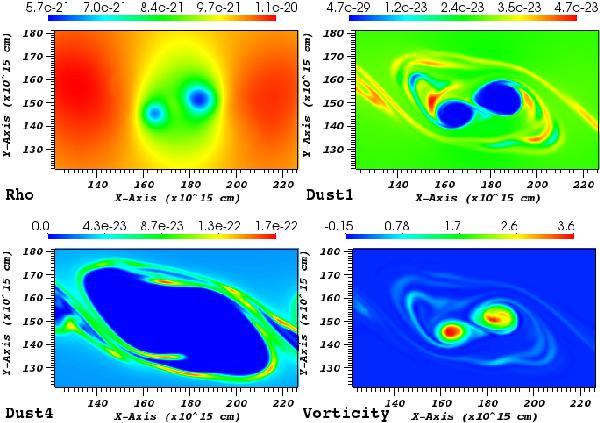
Density distribution of the gas (top left), the lightest dust species (top right), and the heaviest dust species (bottom left), as well as the vorticity of the gas fluid (bottom right) at t = 60 in a simulation with δ = 0.01 and κ = 0.7968. Only part of the total domain is shown. In the image, the merging of two vortices is ongoing. A clear connection can be seen between the vorticity of the gas and the distribution of the smallest dust species.
Current usage metrics show cumulative count of Article Views (full-text article views including HTML views, PDF and ePub downloads, according to the available data) and Abstracts Views on Vision4Press platform.
Data correspond to usage on the plateform after 2015. The current usage metrics is available 48-96 hours after online publication and is updated daily on week days.
Initial download of the metrics may take a while.